The drawing of graphs described here uses graphviz [DEG+02], a software for drawing graphs developed at AT & T Labs, that can be obtained at https://www.graphviz.org/.
In order to create the drawings you should have graphviz installed and to view them you should have installed some pdf viewer.
‣ DrawAutomaton( A[, state_names, L] ) | ( function ) |
This function draws automaton A. The arguments state_names, L and file are optional.
An automaton with n states will be drawn with numbers 1 to n written inside the corresponding graph node. The argument state_names is a list of n strings which will be the new text written inside the corresponding graph node.
The argument L is a list of lists of integers, each of which specifies a set of states to be drawn in a different color.
gap> x:=Automaton("det",3,2,[ [ 2, 3, 0 ], [ 0, 1, 2 ] ],[ 1 ],[ 1, 2, 3 ]);;
gap> DrawAutomaton(x);

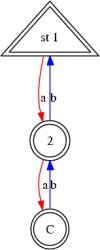
gap> DrawAutomaton(x,["st 1", "2", "C"]);

gap> DrawAutomaton(x,["st 1", "2", "C"],[[2],[1,3]]);
The output of the three previous DrawAutomaton commands would be the following diagrams, respectively.


‣ DotForDrawingAutomaton( arg ) | ( function ) |
This function computes the dot code that can be used to display an automaton. This can be done by using the function DrawAutomaton (B.2-1) (if the system is properly configured) or by the user in some independent way. The arguments and options are the same than those of DrawAutomaton (B.2-1).
gap> DotStringForDrawingAutomaton(x);
"digraph  Automaton{\n\"1\" -> \"2\" [label=\"a\",color=red];\n\"2\" -> \"3\" \
[label=\"a\",color=red];\n\"2\" -> \"1\" [label=\"b\",color=blue];\n\"3\" -> \
\"2\" [label=\"b\",color=blue];\n\"1\" [shape=triangle,peripheries=2, style=fi\
lled, fillcolor=white];\n\"2\" [shape=doublecircle, style=filled, fillcolor=wh\
ite];\n\"3\" [shape=doublecircle, style=filled, fillcolor=white];\n}\n"
By using Print (or PrinTo, if one wants to print to a file) the string is displayed as follows:
gap> Print(last);
digraph  Automaton{
"1" -> "2" [label="a",color=red];
"2" -> "3" [label="a",color=red];
"2" -> "1" [label="b",color=blue];
"3" -> "2" [label="b",color=blue];
"1" [shape=triangle,peripheries=2, style=filled, fillcolor=white];
"2" [shape=doublecircle, style=filled, fillcolor=white];
"3" [shape=doublecircle, style=filled, fillcolor=white];
}
The dot code produced for the remaining pictures:
gap> Print(DotStringForDrawingAutomaton(x,["st 1", "2", "C"]));
digraph  Automaton{
"st 1" -> "2" [label="a",color=red];
"2" -> "C" [label="a",color=red];
"2" -> "st 1" [label="b",color=blue];
"C" -> "2" [label="b",color=blue];
"st 1" [shape=triangle,peripheries=2, style=filled, fillcolor=white];
"2" [shape=doublecircle, style=filled, fillcolor=white];
"C" [shape=doublecircle, style=filled, fillcolor=white];
}
gap> Print(DotStringForDrawingAutomaton(x,["st 1", "2", "C"],[[2],[1,3]]));
digraph  Automaton{
"st 1" -> "2" [label="a",color=red];
"2" -> "C" [label="a",color=red];
"2" -> "st 1" [label="b",color=blue];
"C" -> "2" [label="b",color=blue];
"st 1" [shape=triangle,peripheries=2, style=filled, fillcolor=burlywood];
"2" [shape=doublecircle, style=filled, fillcolor=brown];
"C" [shape=doublecircle, style=filled, fillcolor=burlywood];
}
‣ DrawSubAutomaton( A, B ) | ( function ) |
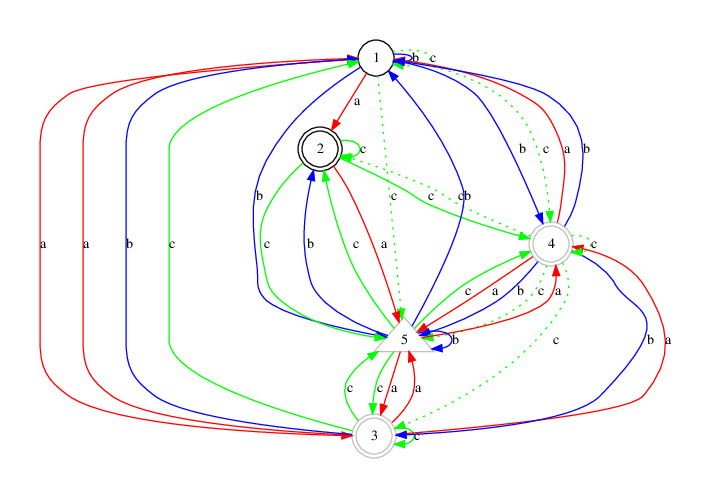
This function tests if automaton A is a subautomaton of B in which case draws B highlighting the edges not in A by drawing them in a dotted style, while the others are drawn in a plain style.
gap> A := Automaton("nondet",5,"abc",[ [ [ 2, 3 ], [ 5 ], [ 1, 4, 5 ], [ 1, 5 ],
[ 3, 4 ] ], [ [ 1, 4, 5 ], [ ], [ 1 ], [ 1, 3, 5 ], [ 1, 2, 5 ] ], [ [ ],
[ 2, 4, 5 ], [ 1, 3, 5 ], [ ], [ 2, 3, 4 ] ] ],[ ],[ 2, 3, 4 ]);;
gap> B := Automaton("nondet",5,"abc",[ [ [ 2, 3 ], [ 5 ], [ 1, 4, 5 ], [ 1, 5 ],
[ 3, 4 ] ], [ [ 1, 4, 5 ], [ ], [ 1 ], [ 1, 3, 5 ], [ 1, 2, 5 ] ], [ [ 1, 4, 5 ],
[ 2, 4, 5 ], [ 1, 3, 5 ], [ 2, 3, 4, 5 ], [ 2, 3, 4 ] ] ],[ 3, 4, 5 ],[ 2, 3, 4 ]);;
gap> DrawSubAutomaton(A,B);
The output is as follows, in case the configuration of your computer permits. Otherwise, you may be interested in the dot code, as pshown below.

‣ DotStringForDrawingSubAutomaton( A, B ) | ( function ) |
This function computes the dot code that can be used to draw automata A, with the subsutomaton B emphasized. It is silently used by the function DrawSubAutomaton (B.2-3) (if the system is properly configured) or can be used by the user in some independent way.
gap> DotStringForDrawingSubAutomaton(A,B);
"digraph  Automaton {\n1 -> 2 [label=\"a\",color=red];\n1 -> 3 [label=\"a\",co\
lor=red];\n1 -> 1 [label=\"b\",color=blue];\n1 -> 4 [label=\"b\",color=blue];\
\n1 -> 5 [label=\"b\",color=blue];\n1 -> 1 [label=\"c\",color=green,style = do\
tted];\n1 -> 4 [label=\"c\",color=green,style = dotted];\n1 -> 5 [label=\"c\",\
color=green,style = dotted];\n2 -> 5 [label=\"a\",color=red];\n2 -> 2 [label=\
\"c\",color=green];\n2 -> 4 [label=\"c\",color=green];\n2 -> 5 [label=\"c\",co\
lor=green];\n3 -> 1 [label=\"a\",color=red];\n3 -> 4 [label=\"a\",color=red];\
\n3 -> 5 [label=\"a\",color=red];\n3 -> 1 [label=\"b\",color=blue];\n3 -> 1 [l\
abel=\"c\",color=green];\n3 -> 3 [label=\"c\",color=green];\n3 -> 5 [label=\"c\
\",color=green];\n4 -> 1 [label=\"a\",color=red];\n4 -> 5 [label=\"a\",color=r\
ed];\n4 -> 1 [label=\"b\",color=blue];\n4 -> 3 [label=\"b\",color=blue];\n4 ->\
 5 [label=\"b\",color=blue];\n4 -> 2 [label=\"c\",color=green,style = dotted];\
\n4 -> 3 [label=\"c\",color=green,style = dotted];\n4 -> 4 [label=\"c\",color=\
green,style = dotted];\n4 -> 5 [label=\"c\",color=green,style = dotted];\n5 ->\
 3 [label=\"a\",color=red];\n5 -> 4 [label=\"a\",color=red];\n5 -> 1 [label=\"\
b\",color=blue];\n5 -> 2 [label=\"b\",color=blue];\n5 -> 5 [label=\"b\",color=\
blue];\n5 -> 2 [label=\"c\",color=green];\n5 -> 3 [label=\"c\",color=green];\n\
5 -> 4 [label=\"c\",color=green];\n3 [shape=triangle,color=gray];\n4 [shape=tr\
iangle,color=gray];\n5 [shape=triangle,color=gray];\n2 [shape=doublecircle];\n\
3 [shape=doublecircle];\n4 [shape=doublecircle];\n1 [shape=circle];\n}\n"
By using Print (or PrinTo, if one wants to print to a file) the string is displayed as follows:
gap> Print(last);
digraph  Automaton {
1 -> 2 [label="a",color=red];
1 -> 3 [label="a",color=red];
1 -> 1 [label="b",color=blue];
1 -> 4 [label="b",color=blue];
1 -> 5 [label="b",color=blue];
1 -> 1 [label="c",color=green,style = dotted];
1 -> 4 [label="c",color=green,style = dotted];
1 -> 5 [label="c",color=green,style = dotted];
2 -> 5 [label="a",color=red];
2 -> 2 [label="c",color=green];
2 -> 4 [label="c",color=green];
2 -> 5 [label="c",color=green];
3 -> 1 [label="a",color=red];
3 -> 4 [label="a",color=red];
3 -> 5 [label="a",color=red];
3 -> 1 [label="b",color=blue];
3 -> 1 [label="c",color=green];
3 -> 3 [label="c",color=green];
3 -> 5 [label="c",color=green];
4 -> 1 [label="a",color=red];
4 -> 5 [label="a",color=red];
4 -> 1 [label="b",color=blue];
4 -> 3 [label="b",color=blue];
4 -> 5 [label="b",color=blue];
4 -> 2 [label="c",color=green,style = dotted];
4 -> 3 [label="c",color=green,style = dotted];
4 -> 4 [label="c",color=green,style = dotted];
4 -> 5 [label="c",color=green,style = dotted];
5 -> 3 [label="a",color=red];
5 -> 4 [label="a",color=red];
5 -> 1 [label="b",color=blue];
5 -> 2 [label="b",color=blue];
5 -> 5 [label="b",color=blue];
5 -> 2 [label="c",color=green];
5 -> 3 [label="c",color=green];
5 -> 4 [label="c",color=green];
3 [shape=triangle,color=gray];
4 [shape=triangle,color=gray];
5 [shape=triangle,color=gray];
2 [shape=doublecircle];
3 [shape=doublecircle];
4 [shape=doublecircle];
1 [shape=circle];
}
‣ DotStringForDrawingGraph( G ) | ( function ) |
‣ DrawGraph( G ) | ( function ) |
Draws a graph specified as an adjacency list G.
gap> G := [[1,2,3],[5],[3,4],[1],[2,5]];
[ [ 1, 2, 3 ], [ 5 ], [ 3, 4 ], [ 1 ], [ 2, 5 ] ]
gap> Print(DotStringForDrawingGraph(G));
digraph Graph__{
1 -> 1 [style=bold, color=black];
1 -> 2 [style=bold, color=black];
1 -> 3 [style=bold, color=black];
2 -> 5 [style=bold, color=black];
3 -> 3 [style=bold, color=black];
3 -> 4 [style=bold, color=black];
4 -> 1 [style=bold, color=black];
5 -> 2 [style=bold, color=black];
5 -> 5 [style=bold, color=black];
1 [shape=circle];
2 [shape=circle];
3 [shape=circle];
4 [shape=circle];
5 [shape=circle];
}
The dot code can be used to produce the following picture (which may also be produced by typing DrawGraph(G);

‣ DrawSCCAutomaton( A[, state_names, L] ) | ( function ) |
Draws automaton A and highlights it's strongly connected components by drawing the other edges in a dotted style.
The optional arguments state_names and L are as described in DrawAutomaton (B.2-1).
gap> rcg := Automaton("det",6,"ab",[ [ 3, 3, 6, 5, 6, 6 ], [ 4, 6, 2, 6, 4, 6 ] ],
[ ],[ ]);;
gap> Print(DotStringForDrawingSCCAutomaton(rcg));
digraph  Automaton{
"1" -> "3" [label="a",color=red,style = dotted];
"2" -> "3" [label="a",color=red];
"3" -> "6" [label="a",color=red,style = dotted];
"4" -> "5" [label="a",color=red];
"5" -> "6" [label="a",color=red,style = dotted];
"6" -> "6" [label="a",color=red,style = dotted];
"1" -> "4" [label="b",color=blue,style = dotted];
"2" -> "6" [label="b",color=blue,style = dotted];
"3" -> "2" [label="b",color=blue];
"4" -> "6" [label="b",color=blue,style = dotted];
"5" -> "4" [label="b",color=blue];
"6" -> "6" [label="b",color=blue,style = dotted];
"1" [shape=circle, style=filled, fillcolor=white];
"2" [shape=circle, style=filled, fillcolor=white];
"3" [shape=circle, style=filled, fillcolor=white];
"4" [shape=circle, style=filled, fillcolor=white];
"5" [shape=circle, style=filled, fillcolor=white];
"6" [shape=circle, style=filled, fillcolor=white];
}
The dot code can be used to produce the following picture (which may also be produced by typing DrawGraph(G);

generated by GAPDoc2HTML